This is the second phase of my project where I am working on classifying the text, reviews in my case. Our goal is to build a model which classify the user’s review for a product to a rating class(1-5). The easiest way to implement Naive Bayes classifier is to use sklearn but I’ve implemented Naive Bayes(NB) Classifier by finding conditional probabilities using Bayes Theorem.
Why Naive Bayes Classifier?
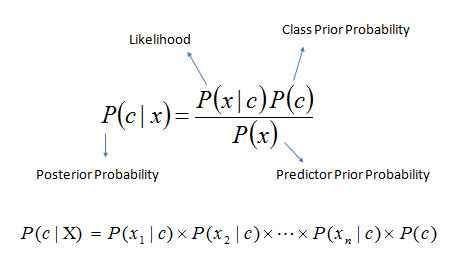
Naive Bayes is the easiest and effective classifier. Naive Bayes is popular for text classification. It uses Bayes theorem to find the probability of the class. There are other classifiers but every classifier has pros and cons.
Why it is called Naive?
In multiple features condition we naively assume that the features are independent of each other and so that likelihood probabilities can be multiplied as shown in above formula. During our calculation we can ignore the denominator because this value will remain the same for every time. We just need to compare the probabilities.
I am using amazon unlocked phone dataset from kaggle.
Feature Engineering
Feature engineering is the most important step of any classification. In my dataset, every row is the user review of a phone. It has multiple columns like product name, brand name, price, reviews, rating and rating votes but only columns required for our classification is reviews and its rating.
First step is to clean the data. After analysing the data I saw there are many duplicate reviews for the similar products. We have many phones which are same but different in color for example there are multiple entries of Samsung S10 with color Black, Grey, White with same reviews and ratings. First we remove the duplicate reviews. After this step my dataset was approximately reduced to half. Please checkout my code on github.
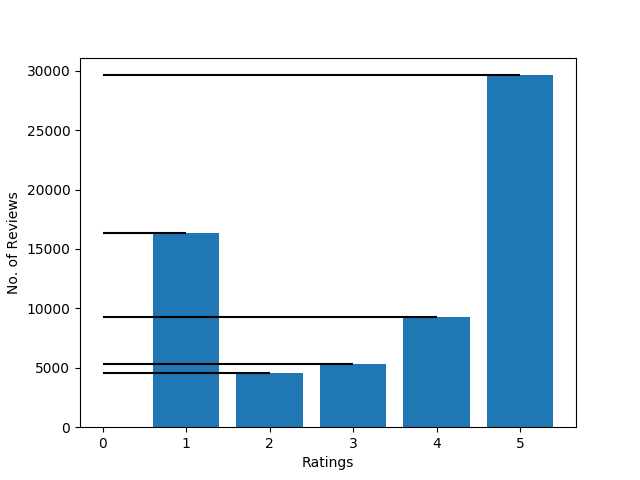
If we plot a histogram of the ratings vs number of reviews then we will see that around 75% of the reviews are given rating either 1 or 5.
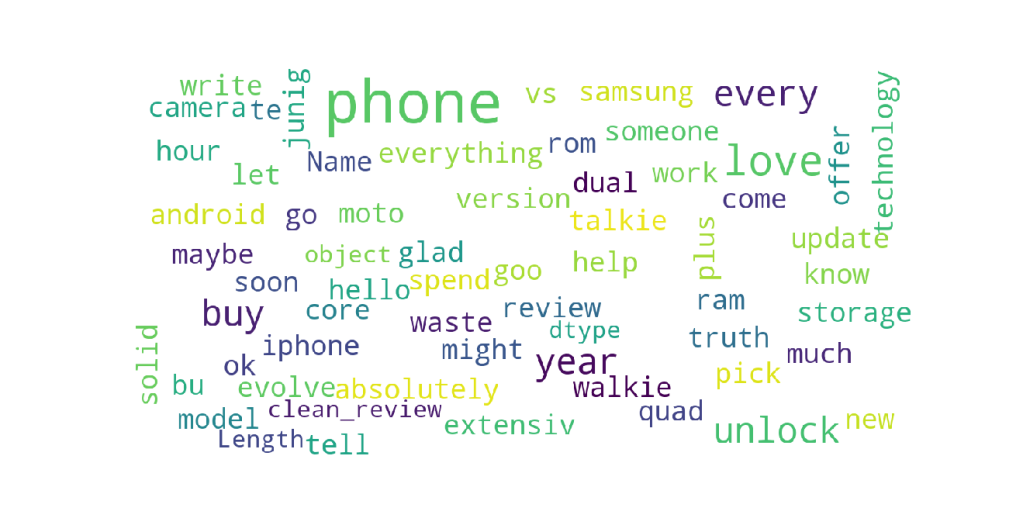
If we look at the most frequent words in the reviews then we’ll see that most occurring words are phone, love, glad, buy, every, year, unlock etc.
WordCloud
Lets see the top frequent words per rating class:
Rating 1: return, buy, worst, not, get, disappointed, waste
Rating 2: phone, battery, back, call, new
Rating 3: time, go, might, let, truth, vs, offer
Rating 4: screen, like, come, good, use, work, price, one, camera
Rating 5: great, love, happy, glad, plus
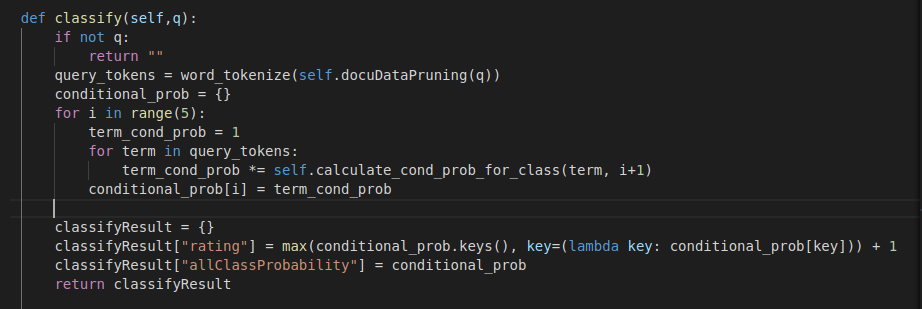
In NB Classifier every word in the review will be considered as a feature. We follow the Bag of Words(BOW) implementation. We divide the dataset into train, test and dev dataset with the 60:20:20 ratio and do preprocessing on the train data. We use dev dataset for the evaluation whereas train dataset is used for training and test dataset for testing purpose. In preprocessing we calculate the frequency of every word for every rating class. Preprocessing is important to calculate the probabilities quickly. Once we have the frequency of words for every class then we compute the probability of every word in the text query from train data or from user input. In our case we have five rating classes (1-5), so, we will find the probability for every class and predict the rating class which has the highest probability.
Calculation
Contribution
I tried to optimize the model using different techniques like:
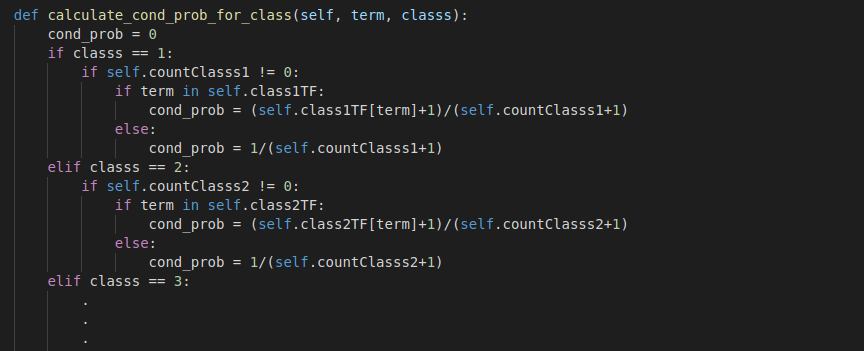
1) Smoothing:
Assume a case when we searched for some keywords which were not present in the dataset then in that case frequency becomes zero which will result in divide by zero error so to prevent this error we use Laplace Smoothing. We add 1 to the numerator and denominator of the likelihood probability.
2) Hyper parameter tuning:
To get the best model we need to tune our model to the best optimized values of the hyper parameter. I tried different models like KNN, SVM, Decision Tree, Naive Bayes by changing the hyper-parameters values. I plotted the graph of model accuracy vs different parameter to visualize it clearly. These results are discussed in detail in the evaluation section below.
3) Optimal Data set selection:
I ran model with different dataset size and different split ratio. Our finding is, as we increase the size of dataset, its accuracy increases. Different split size has very less effect on the accuracy but main idea is as we increase the data size for training set, its accuracy increase. Some of the results are discussed below.
Evaluation
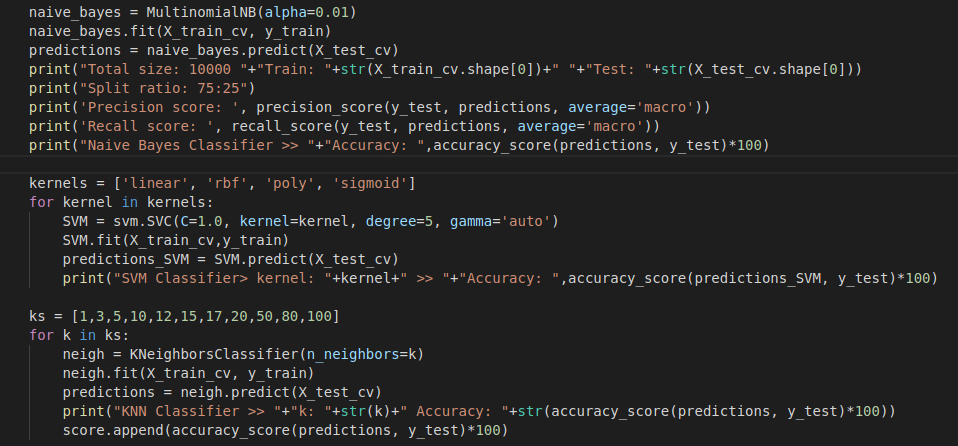
1. Support Vector Machine (SVM)
SVM is a supervised learning model which output the most optimal hyperplane which distinguish the data. Unlike Naive Bayes Classifier, I used Sklearn library to run this model because implementing svm is challenging. I tried model with different hyperparameters like by changing kernels, C value, Degree. Below are some findings.
Note: All the evaluation is done without removing stopwords and without using stemmer or lammatization. If we use these techniques as I used on my implemented method then accuracy will increase.
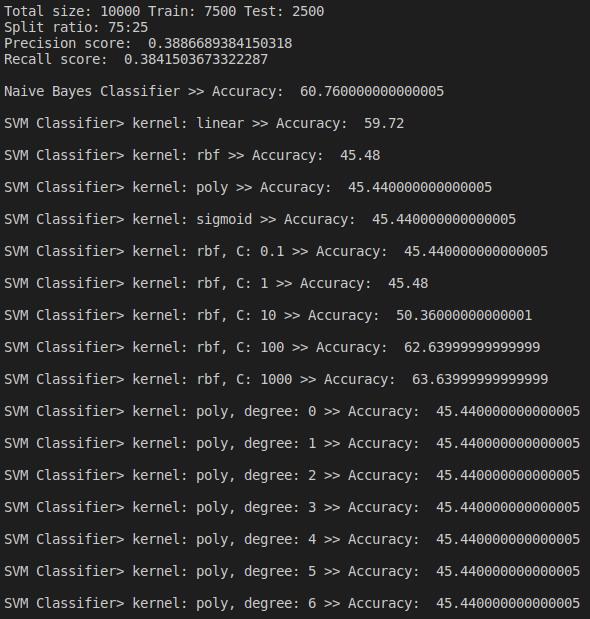
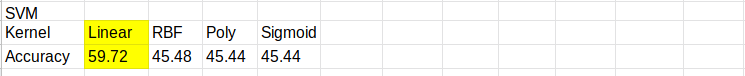

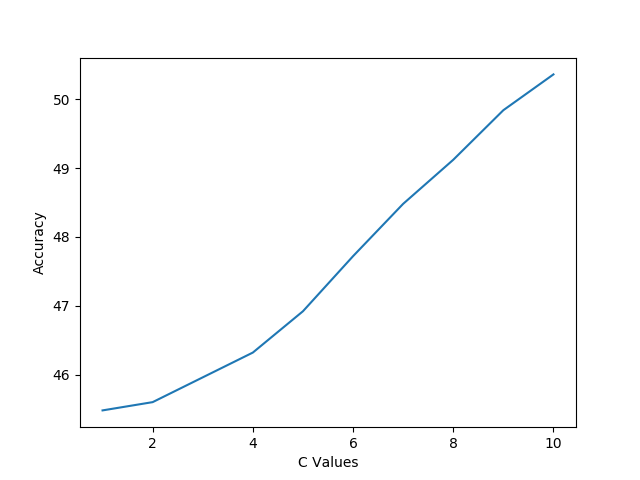
In above findings, we saw that linear kernel gives the most accurate result. We also saw that changing c parameter also affect the accuracy of the system whereas in our case changing degree didn’t accuracy. Best accuracy 59.72% was achieved when linear kernel was used but still which is less than the accuracy of Naive Bayes which was 60.76%
2. KNN Classifier
K-Nearest Neighbour classifier is an easy and simple non-parametric method used for classifying and regression. It’s working is simple. It calculates the distance between the data points and return the k nearest data points that is why it is called K nearest neighbour algorithm. Below are some findings based on changing k value.

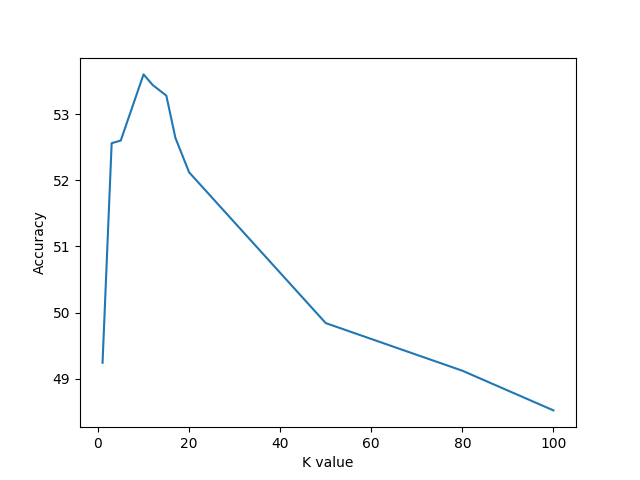
We found that best accuracy of KNN is 53.6% when k=10 which is still lesser that than the best accuracy of SVM model which is 59.72% when linear kernel was used.
3. Naive Bayes Classifier
We do evaluation by changing parameters and find the Confusion Matrix, Precision, Recall and Accuracy of the model. I tried changing the dataset size and their split ratios. Below are the results of the naive bayes model I implemented(not using sklearn).
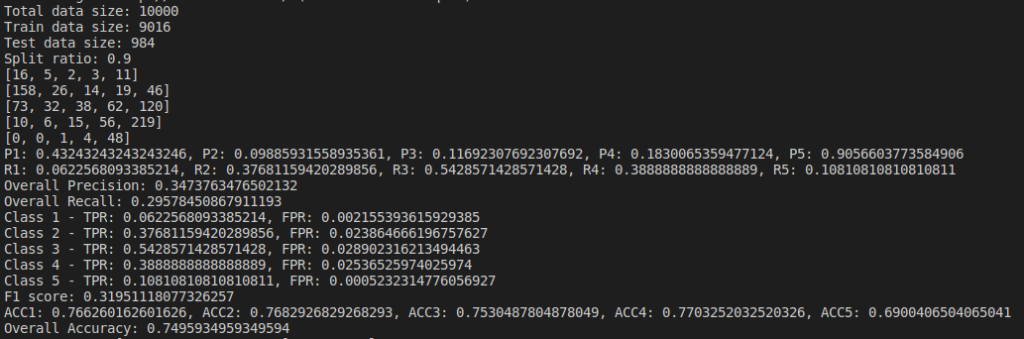
Below are the results based on different split ratio and different dataset size tried. First row have data size of 5k rows, 2nd row have data size of 10k rows, 3rd row have data size of 30k rows and 4th row have data size of 65k rows. First column has split ratio of 0.7, 2nd column has split ratio of 0.8 and 3rd column has split ratio of 0.9
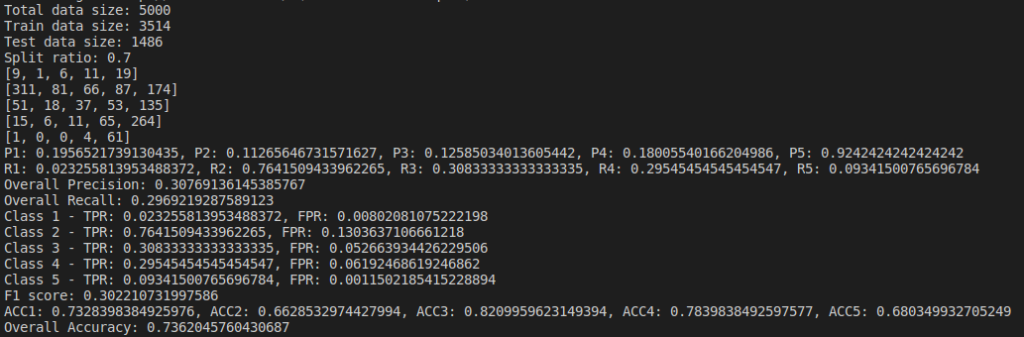
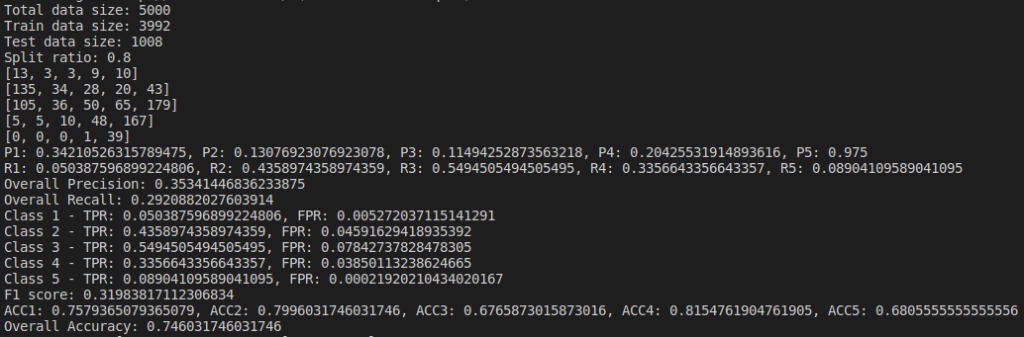
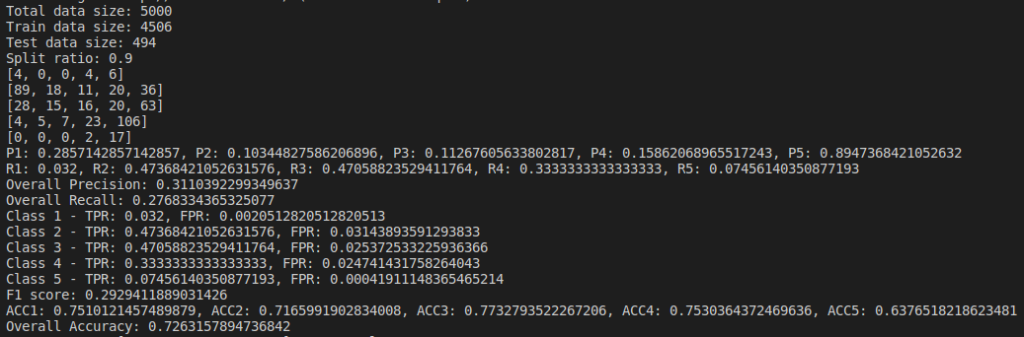
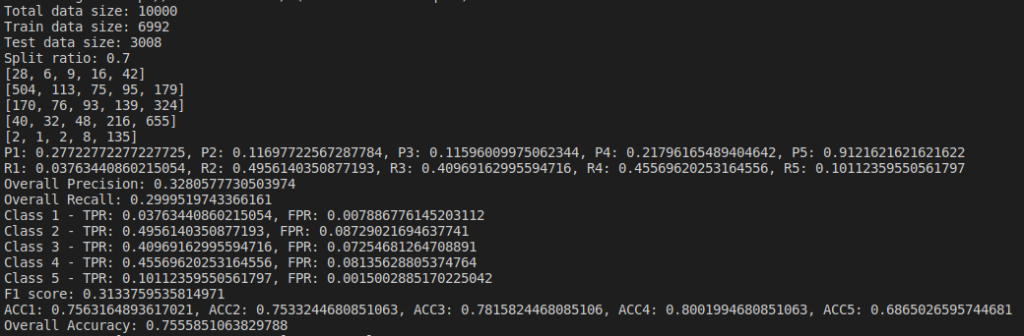
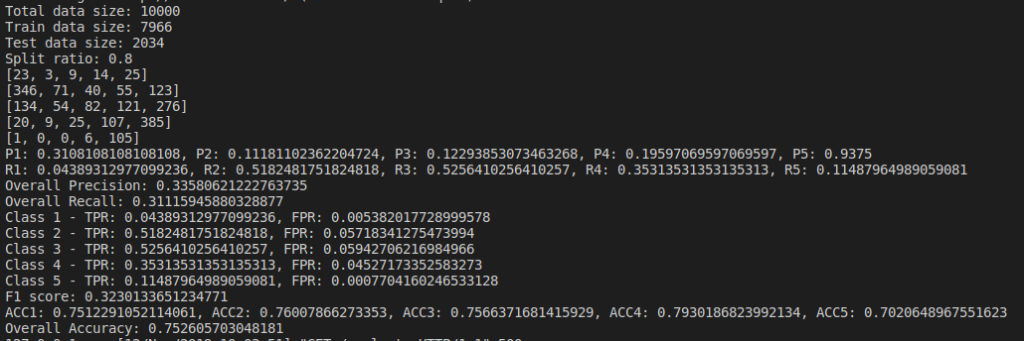

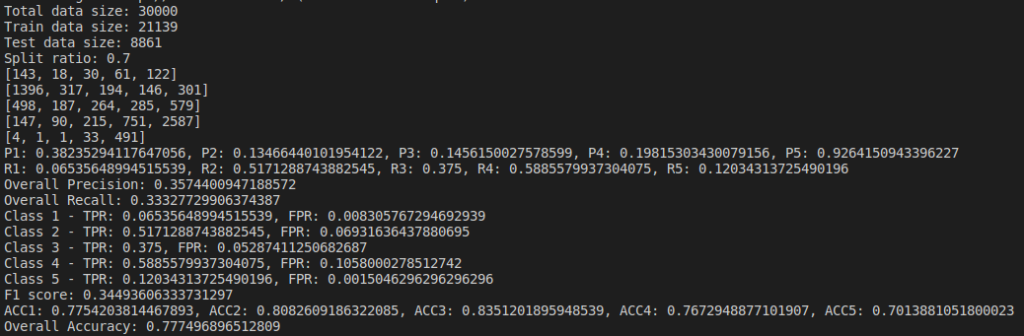
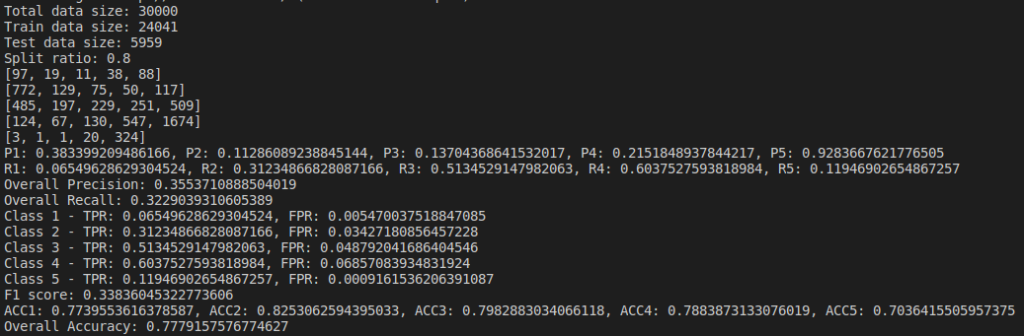
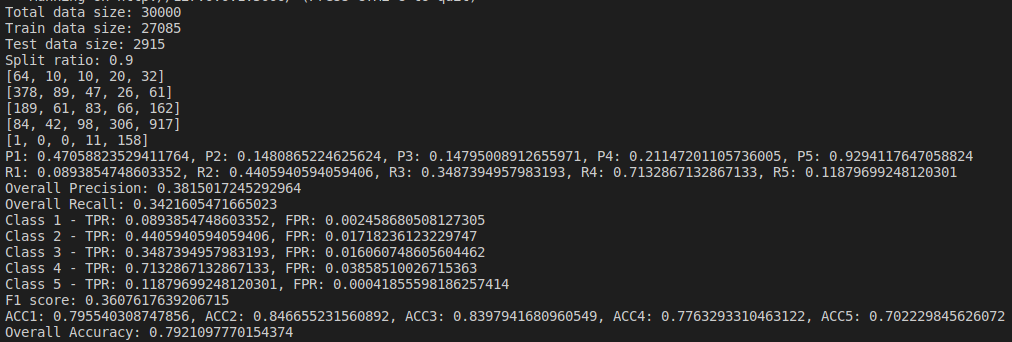
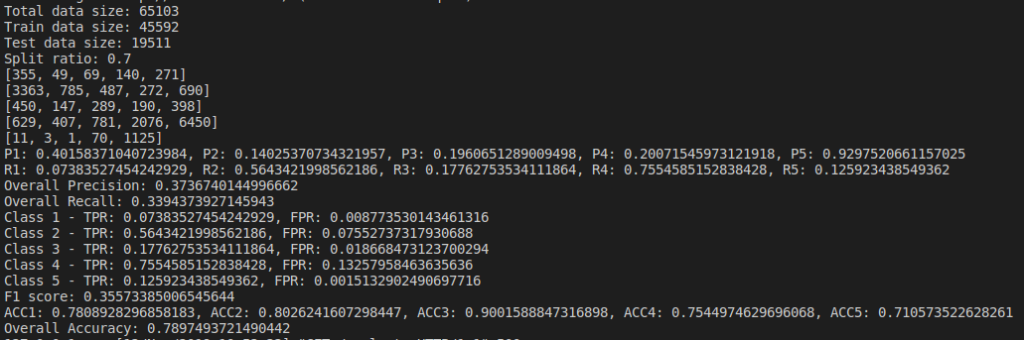
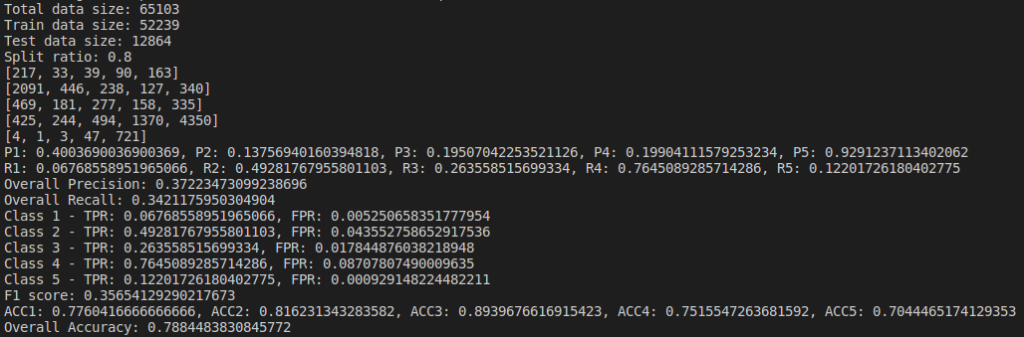

Some of the findings from the above result are, as we increase the size of dataset, accuracy increases.
4. Decision Tree
Decision Tree is easy to understand and very popular algorithm which can be used in classification and regression problems. A decision tree is tree-like structure where internal nodes represent attributes, leaf nodes represent decision and edges represent the rules. It’s training time is fast and it can handle high dimensional data. Attributes are selected using criterion like Gini Index and Entropy. Gini index tells us the impurity.
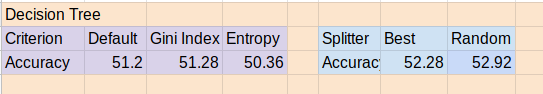
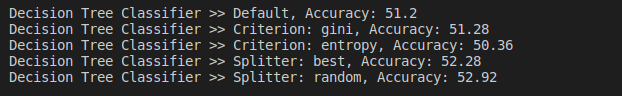
Best accuracy of Decision Tree classifier is 52.92% which comes when we use random splitter with default criterion i.e Gini index. We see that overall accuracy of decision tree is very less than what we have achieved using KNN, SVM and Naive Bayes.
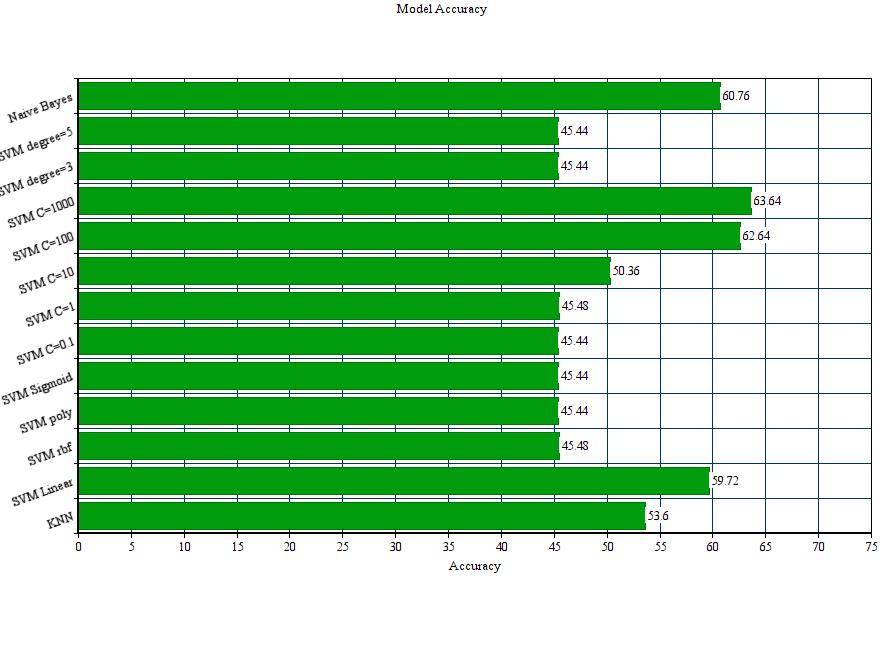
Below is the consolidated graph of accuracy comparison of different classifier used with different hyper-parameter tuning. It seems like SVM model and Naive Bayes models are best classifier for the given text classification.
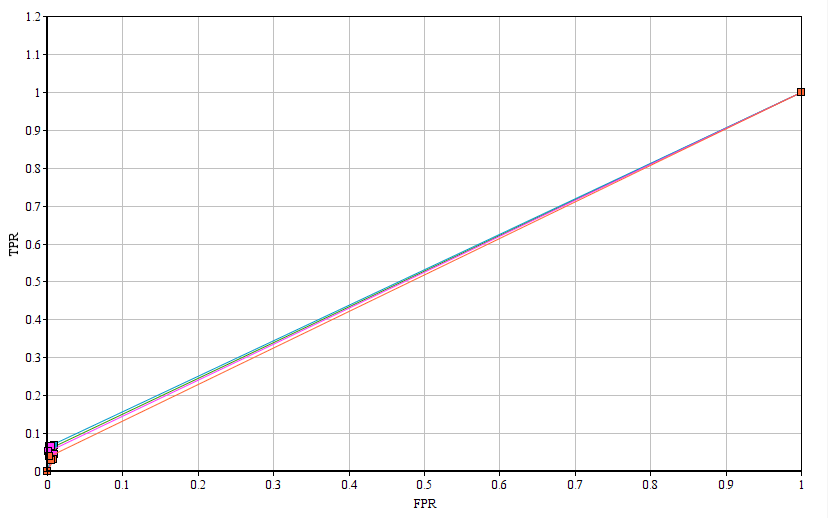
This ROC curve doesn’t look as it should be but I need to conduct more test so that more data points be generated to draw this curve perfectly.
5. Root Mean Square Error
Root mean square error can be calculated to find how the predicted result deviated from the actual result. For example actual class of the review is 2 but our classifiers evaluated it to be 1 with probability 0.4, 2 with probability of 0.2, 3 with probability of 0.2, 4 with probability of 0.1 and 5 with probability of 0.1. In simple case, we can say class 1 has highest probability, so, predicted class will be 1 but there are other classes which have significant probability to occur. In this case we calculate Root Mean Square Error (RMS) to find the error.

This RMSE value will be the certificate to say that how much accurate our classifier’s result is. If RMSE is large then we say error is high. If RMSE is small we say error is less and classifier is classifying with minimum error.
Challenges Faced
After seeing the result of the evaluation, we came to the conclusion that accuracy is very low. Possible reasons I can think of are:
- There is no validation of the rating given by user to the review it has written for example if a user likes the phone but unhappy with the delivery or discount then even though the review written is positive for phone but rating given is low. These reviews will make the data sparse.
- How to tackle the semantic meaning of the negation of the words for example if in a negative review instead of using negative words like “bad” if a user uses word “not good” then how we will get to know that it belongs to lower rating. As in many of the positive reviews word “good” would have been used so model will give higher probability to on the bases of word good.
Future Development
With Naive Bayes classifier we can not solve the problem of semantic meaning and this is out of scope of this blog and project and there is a good reference provided by Prof. Deokgun Park for future work https://www-nlp.stanford.edu/pubs/SocherEtAl_EMNLP2013.pdf.
References
- https://github.com/jonathanoheix/Sentiment-analysis-with-hotel-reviews/blob/master/Sentiment%20analysis%20with%20hotel%20reviews.ipynb
- https://chrisalbon.com/machine_learning/naive_bayes/naive_bayes_classifier_from_scratch/
- https://www.datacamp.com/community/tutorials/naive-bayes-scikit-learn
- https://towardsdatascience.com/how-to-select-the-right-evaluation-metric-for-machine-learning-models-part-1-regrression-metrics-3606e25beae0
Dataset
https://www.kaggle.com/PromptCloudHQ/amazon-reviews-unlocked-mobile-phones
